Debugging Workflows in Visual Studio
In Workflow Studio, you have the option to debug your designed workflows using either the CLR Debugger or Visual Studio. Debugging is a crucial step that allows you to examine your workflow code, observe its outcomes, and identify any potential issues.
This article will guide you through the process of debugging a workflow using Visual Studio, enabling you to efficiently troubleshoot and refine your workflow for optimal performance and reliability.
Procedure
-
Compile and publish the workflow you wish to debug to the Workflow Server.
-
Restart the EmpowerID Web Role Service.
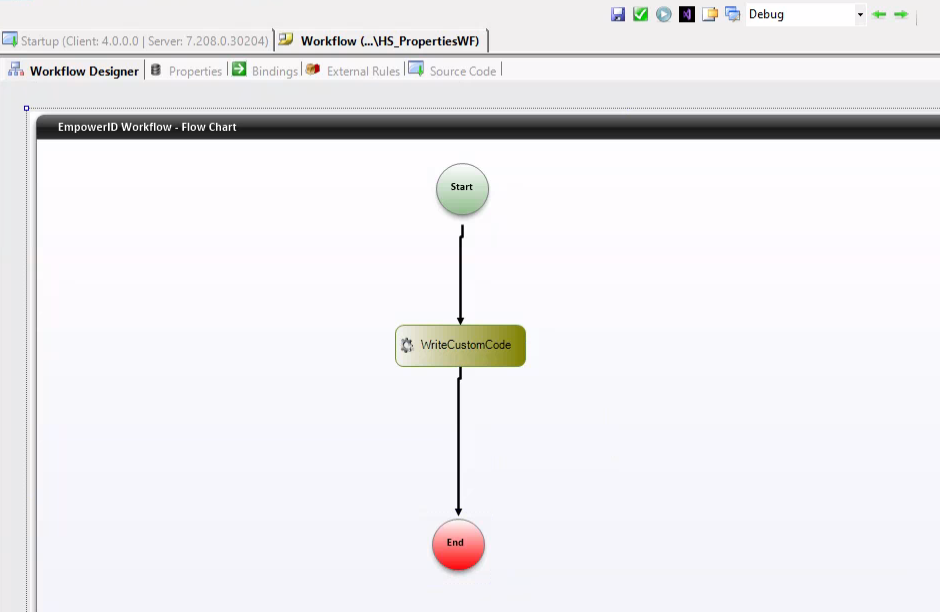
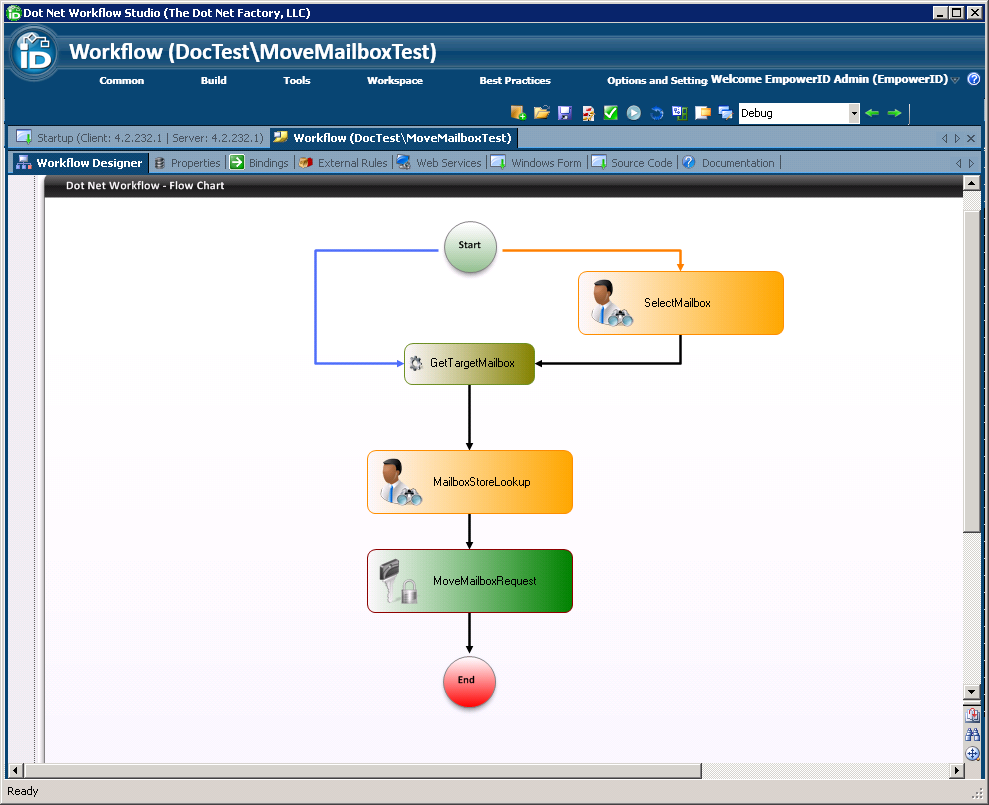
In our example, we are debugging two test workflows. One with the newer version of Workflow Studio and Visual Studio and the other with the older version of Workflow Studio and Visual Studio while the steps are the same for both workflows, there are differences in the user interfaces (UI) of Workflow Studio and Visual Studio.

-
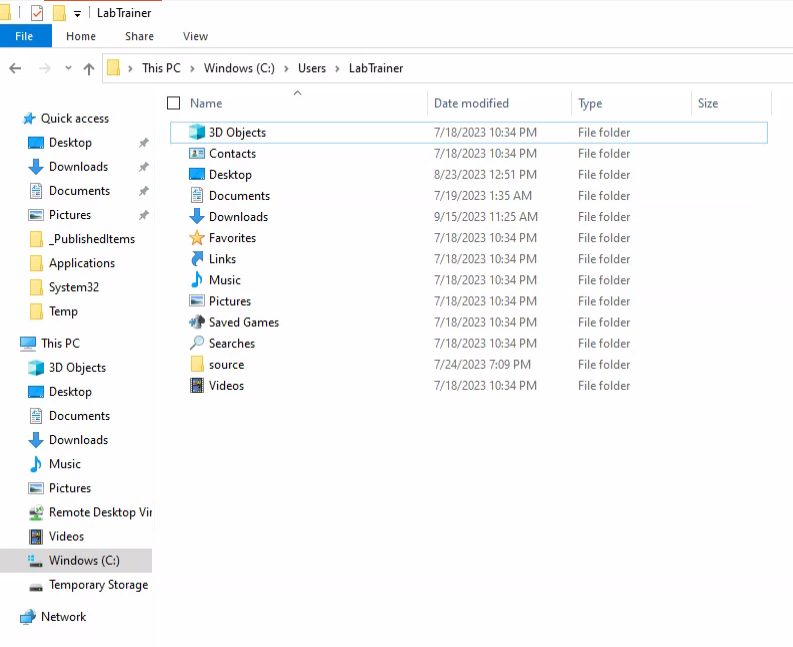
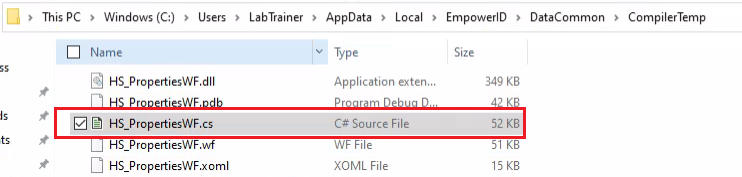
Start Visual Studio and from the File menu, select Open > File, navigate to "C:\Users<YourUserFolder>\AppData\Local\EmpowerID\DataCommon\CompilerTemp," select the .cs file for the workflow you want to debug, and click Open.
-
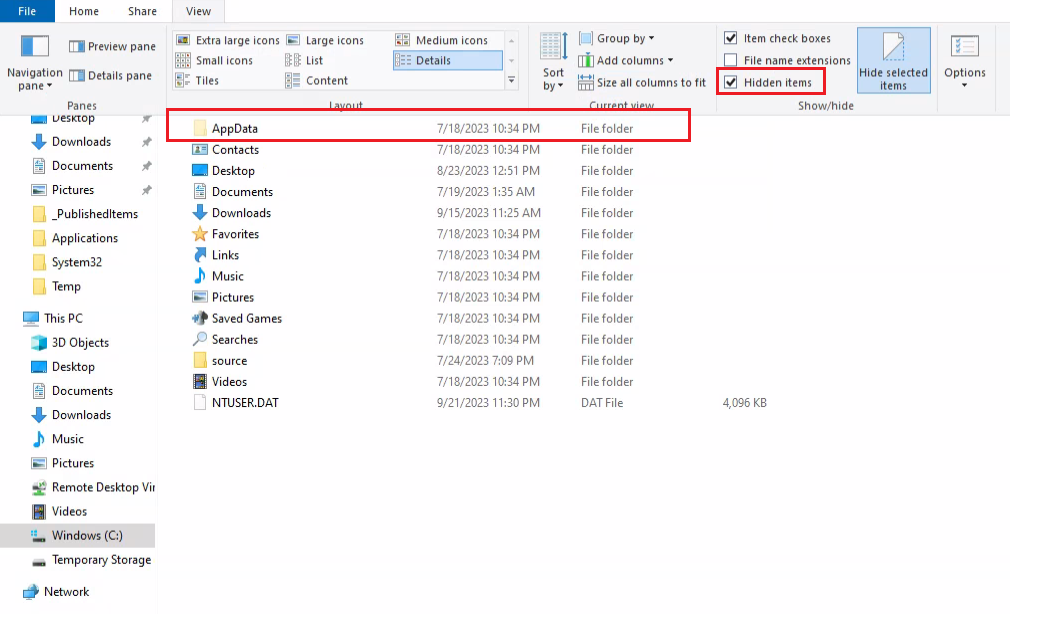
If the AppData folder is not visible, go to the View menu, and then click on Hidden Items. This action will make the AppData folder visible. (Skip this step if you were able to find the AppData folder in the previous step)
- From the CompilerTemp folder, select the .cs file for the Workflow you want to debug and then click Open.
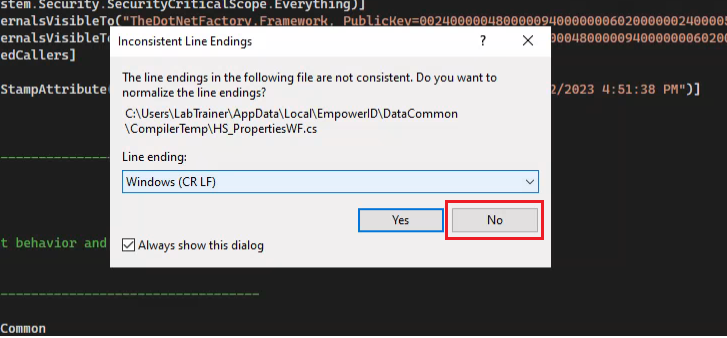
- Click No on the Inconsistent Line Ending dialog that appears.
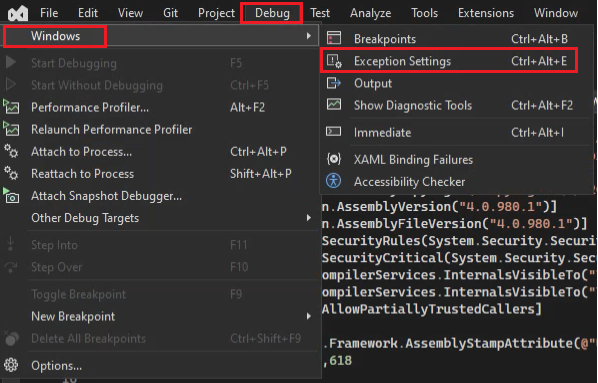
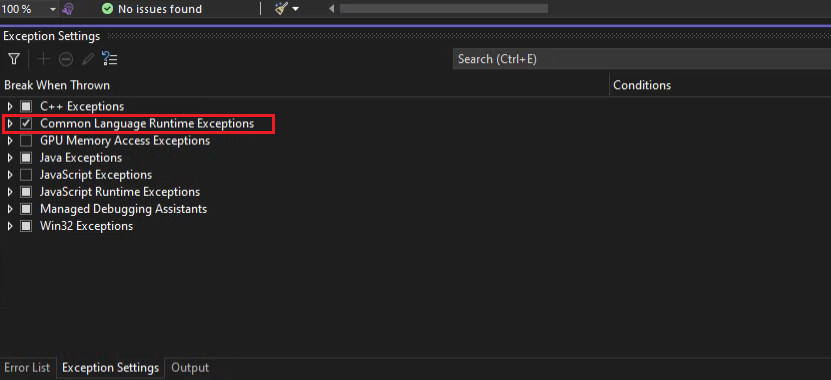
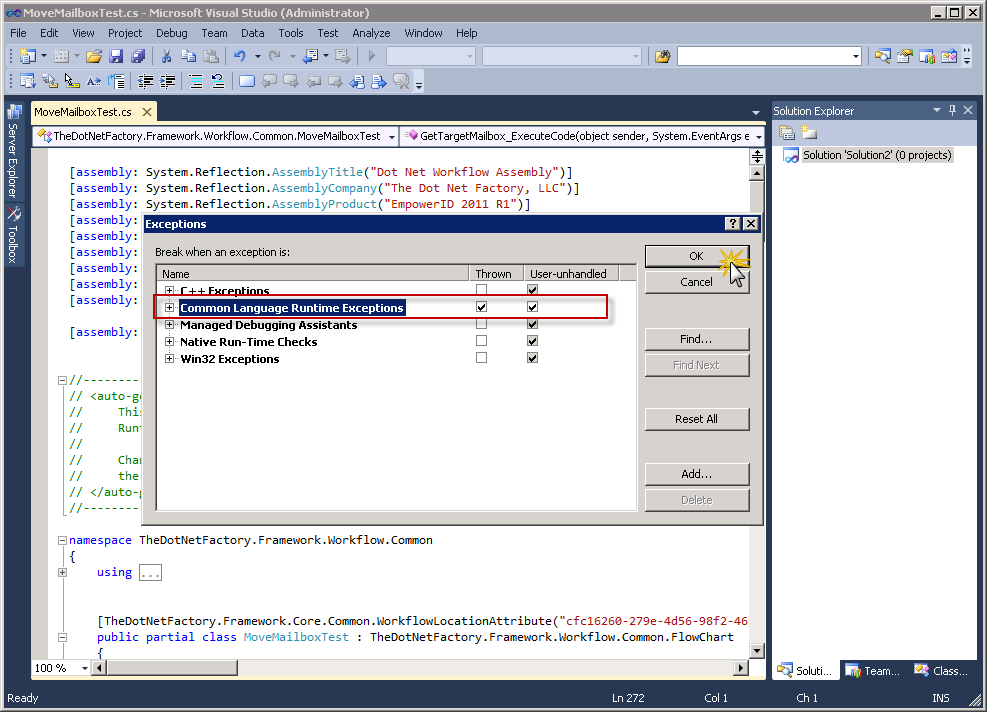
- From the Debug menu in Visual Studio, navigate to Windows and then select Exception Settings. Choose both the Thrown and User-unhandled options for Common Language Runtime Exceptions. If you're using the latest version of Visual Studio, simply check the Common Language Runtime Exceptions option, and then click OK.
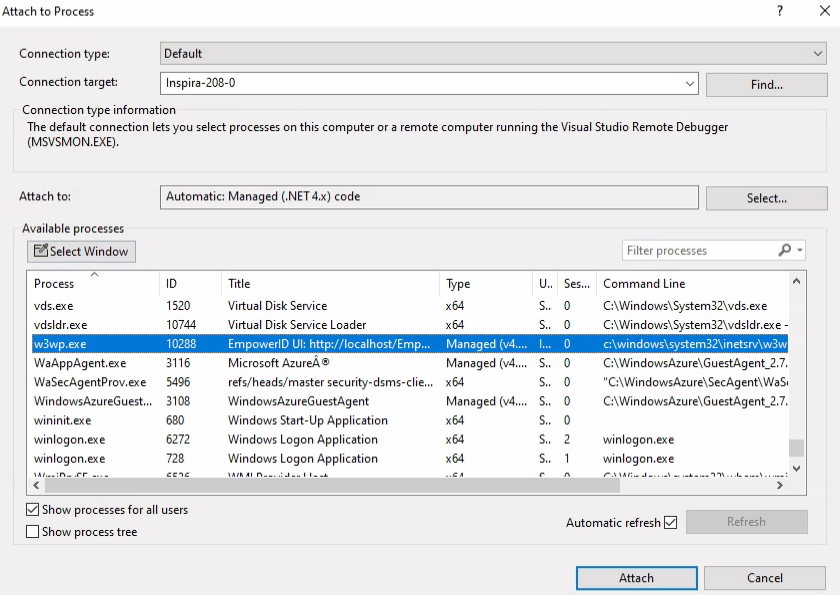
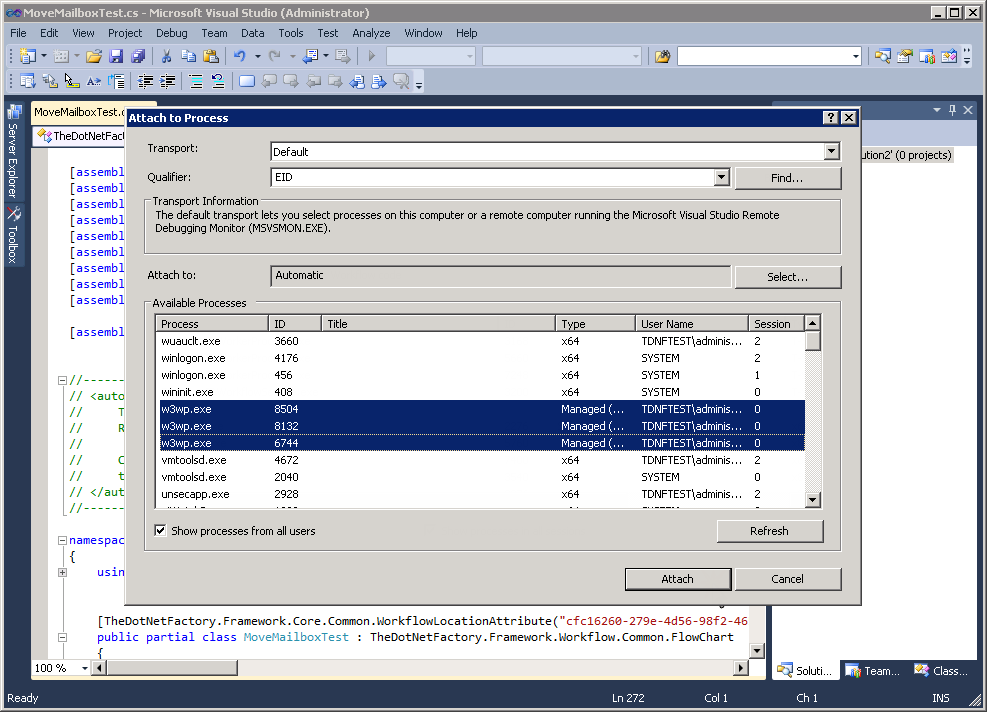
- From the Debug menu of Visual Studio, click on the Attach to Process menu item, select all w3wp.exe processes in the Available Processes pane and then click Attach.
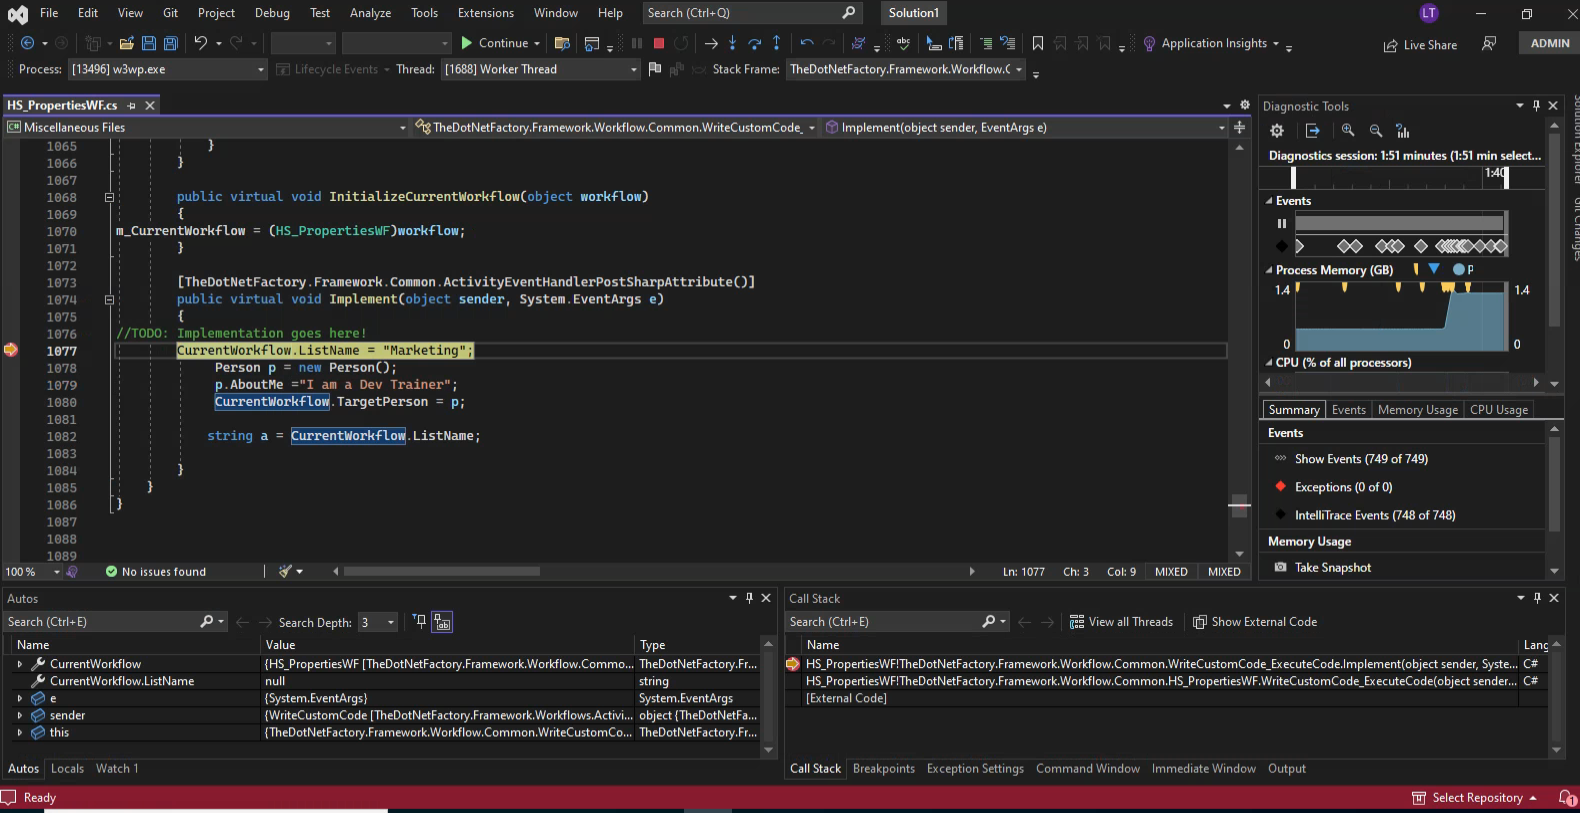
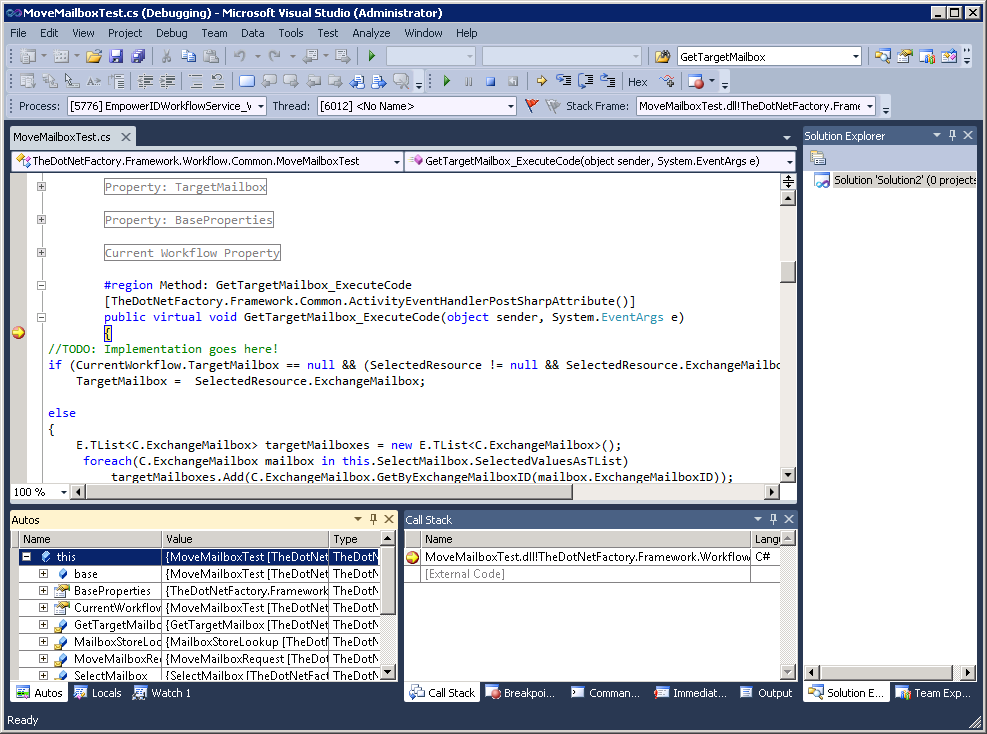
- From the .cs file for the workflow, place a breakpoint in the code editor where desired.
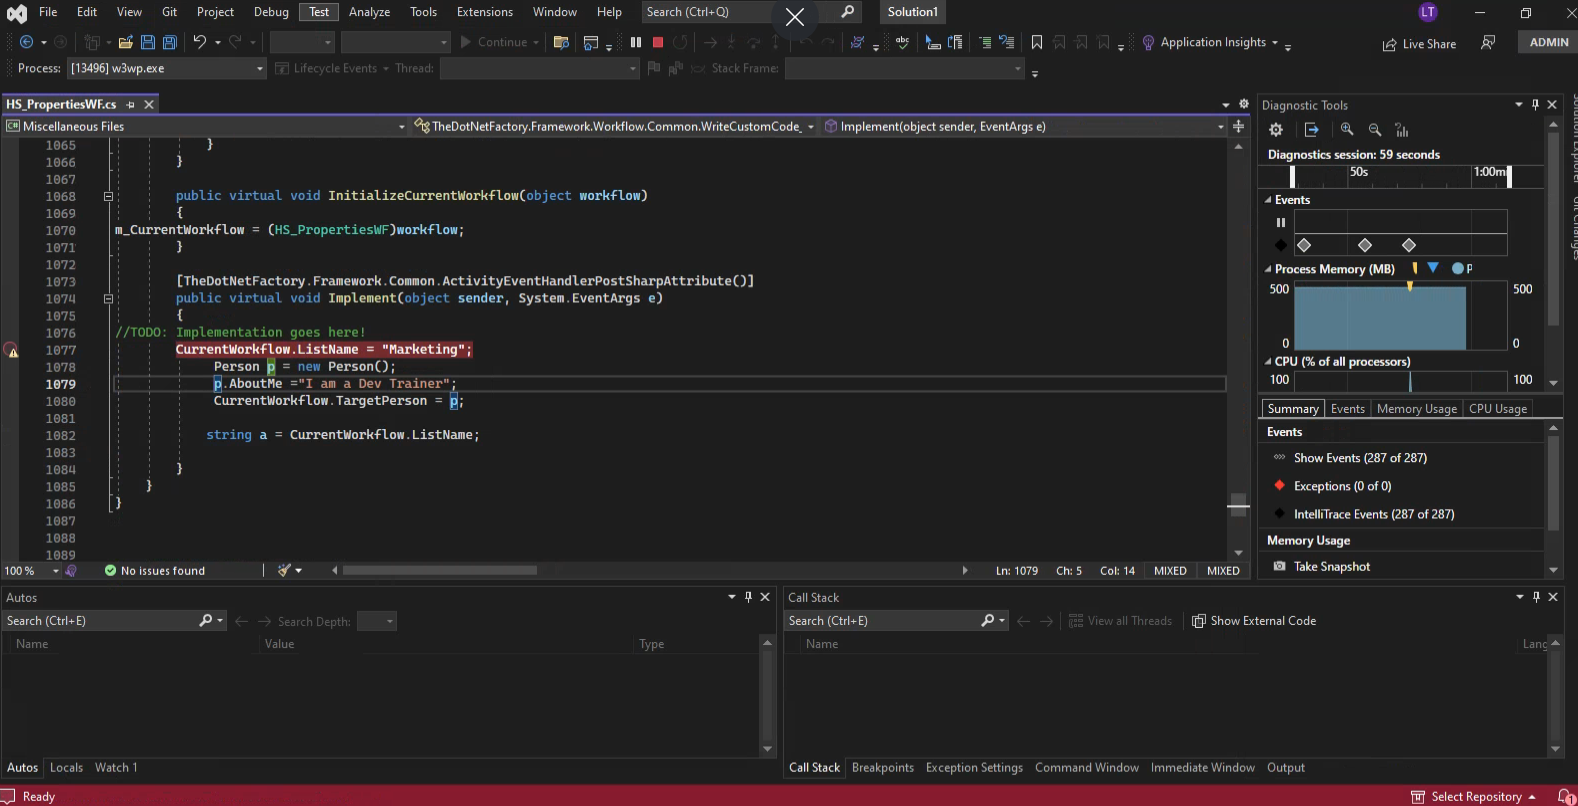
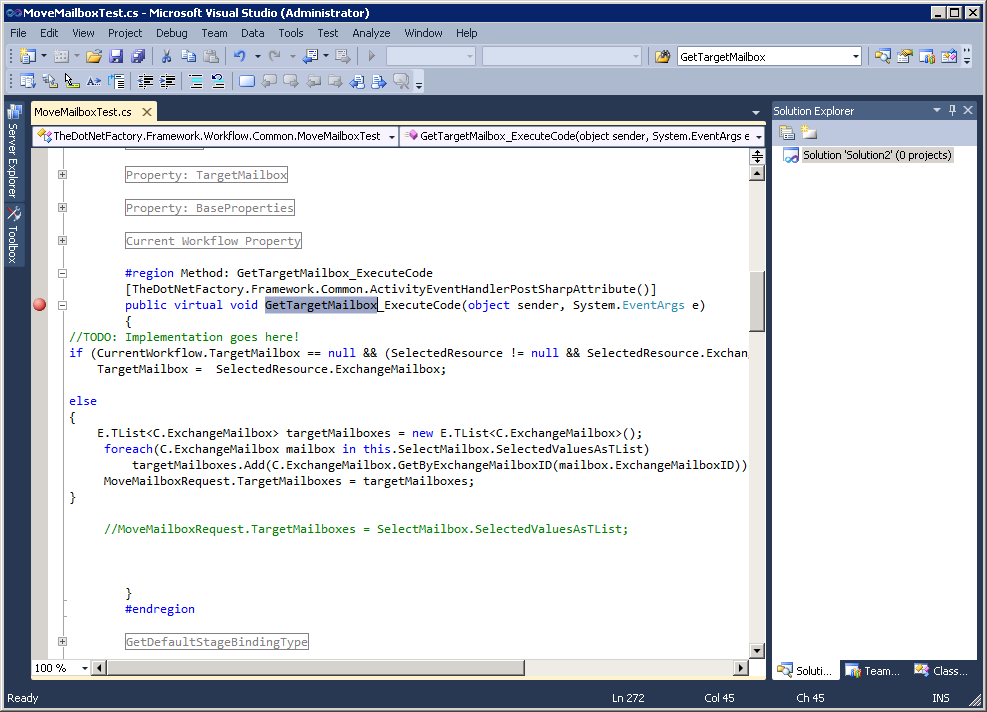
- Run the workflow. When the workflow process reaches the breakpoint placed in the .cs file, the process will stop, allowing you to step through the code and observe what is occurring from Visual Studio.
If you make changes to the source code for the workflow, be sure to republish the workflow. Otherwise, the symbols used when debugging will not match.